
Applications of the Empirical Rule in Statistics and Probability: Discover Real-World Uses
The empirical rule, also known as the 68-95-99.7 rule, is a cornerstone of statistics for analyzing normal distributions. It tells us that 68% of data falls within one standard deviation of the mean, 95% within two, and 99.7% within three. This rule shines in real-world scenarios, helping students, educators, analysts, and researchers make sense of data in fields like education, finance, and quality control. By applying this rule, you can quickly estimate probabilities and percentages in datasets like grades or stock returns. This guide explores practical applications of the empirical rule, complete with examples and visuals to show its power.
Understanding the Empirical Rule
The empirical rule applies to normal distributions, where data forms a bell-shaped curve. It’s a quick way to estimate how data clusters around the mean (μ) using the standard deviation (σ). For instance:
68% of data lies within μ ± 1σ.
95% falls within μ ± 2σ.
99.7% is within μ ± 3σ.
This makes it ideal for predicting outcomes in datasets that are symmetric and bell-shaped, such as test scores or biological measurements. To understand its broader context, explore our normal distribution guide.

Application 1: Grading and Academic Performance
One of the most common uses of the empirical rule is in education, particularly for analyzing test scores or grades, which often follow a normal distribution.
Example: A university’s final exam scores have a mean of 75 and a standard deviation of 10. Using the empirical rule:
68% of students score between 65 and 85 (75 ± 10).
95% score between 55 and 95 (75 ± 20).
99.7% score between 45 and 105 (75 ± 30).
This helps instructors set grading curves or identify outliers. For instance, a score of 95 is in the top 2.5% (since 95% fall below 95), signaling exceptional performance. You can apply this rule to calculate precise percentages for your class data.
Use Case: Schools use this to determine pass/fail thresholds or award honors, ensuring fair grading based on data distribution.
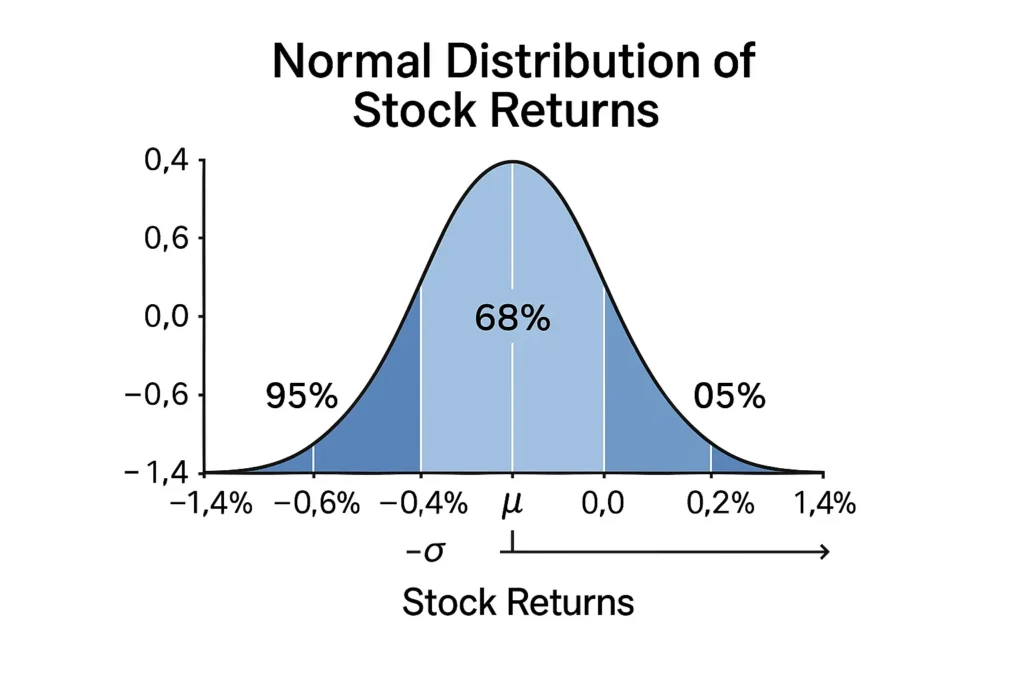
Application 2: Stock Market Analysis
In finance, stock returns often approximate a normal distribution over time, making the empirical rule useful for assessing risk and performance.
Example: A stock’s daily returns have a mean of 0.1% and a standard deviation of 0.5%. Using the empirical rule to find percentages:
68% of daily returns are between -0.4% and 0.6% (0.1 ± 0.5).
95% are between -0.9% and 1.1% (0.1 ± 1.0).
99.7% are between -1.4% and 1.6% (0.1 ± 1.5).
This helps investors estimate the likelihood of gains or losses. For example, there’s a 95% chance returns stay within -0.9% to 1.1%, aiding risk management. Using an empirical rule to find probability calculator simplifies these predictions.
Use Case: Financial analysts use this to evaluate portfolio volatility or set stop-loss limits, ensuring informed investment decisions.
Application 3: Quality Control in Manufacturing
Manufacturers rely on the empirical rule to monitor product quality, especially when measurements like weight or length follow a normal distribution.
Example: A factory produces bolts with a mean length of 10 cm and a standard deviation of 0.2 cm. Using a probability using empirical rule calculator:
68% of bolts are between 9.8 cm and 10.2 cm.
95% are between 9.6 cm and 10.4 cm.
99.7% are between 9.4 cm and 10.6 cm.
If a bolt is 10.5 cm, it’s in the top 2.5% (outside ±2σ), indicating a potential defect. This helps flag items for inspection.
Use Case: Quality control teams use this to set acceptable ranges and reduce defective products, improving efficiency.
Application 4: Biological Measurements
The empirical rule is widely used in biology for analyzing traits like height, weight, or blood pressure, which often form a bell-shaped curve.
Example: Adult male heights in a region have a mean of 70 inches and a standard deviation of 3 inches. Using the empirical rule to find percentage calculator:
68% of men are between 67 and 73 inches.
95% are between 64 and 76 inches.
99.7% are between 61 and 79 inches.
If you’re designing clothing, knowing 95% of men are 64–76 inches tall helps set size ranges. This application is key for medical or ergonomic studies.
Use Case: Researchers use this to study population traits or set health benchmarks, like blood pressure norms.
When to Use the Empirical Rule in Statistics
The empirical rule is best for:
Normal Distributions: Data that forms a bell-shaped curve, confirmed by histograms or normality tests.
Large Samples: Datasets with 30+ observations to ensure approximate normality.
Quick Estimates: When you need fast probabilities or percentages without complex calculations.
For non-normal data (e.g., skewed incomes), consider Chebyshev’s theorem instead. Our normal distribution guide explains when and why normality matters.
Limitations of the Empirical Rule
While powerful, the empirical rule has constraints:
Normal Data Only: It fails for skewed or bimodal distributions.
Sample Size: Small datasets may not be normal, reducing accuracy.
Approximation: The 68-95-99.7% figures are estimates, not exact for imperfectly normal data.
Outliers: Extreme values can skew results, affecting the mean or standard deviation.
Always verify normality before applying the rule to ensure reliable outcomes.
Frequently Asked Questions (FAQs)
It estimates the percentage of data within one, two, or three standard deviations in a normal distribution, simplifying analysis.
Yes, a calculator computes probabilities or percentages for normal data, like the chance of a score falling within a range.
For test scores with a mean of 80 and standard deviation of 5, there’s a 68% chance a score is between 75 and 85.
It doesn’t work for non-normal data, small samples, or datasets with extreme outliers.
It sets acceptable ranges for product measurements, helping identify defects outside the 95% or 99.7% ranges.
Conclusion
The empirical rule is a versatile tool in statistics and probability, offering quick insights into normal distributions. From grading students and analyzing stock returns to ensuring product quality and studying biological traits, its applications are vast and practical. By using an empirical rule to find percentage calculator, you can streamline these analyses with ease. Explore these scenarios with our apply this rule tool, and dive into our normal distribution guide for a deeper understanding of how this rule fits into statistical analysis.
Other Resources:
- What Is the Empirical Rule: A detailed explanation of the 68‑95‑99.7 rule.
- How to Use the Empirical Rule on a Calculator: Step-by-step guide to mastering this tool.
- Empirical Rule vs. Chebyshev’s Theorem: Compare these statistical tools for better analysis.
- Normal Distribution and the Empirical Rule: Comprehensive insights into normal distributions.
- All Tools: Browse our full collection of statistical calculators.