Empirical Rule Calculator - 68 95 99.7 Rule of Normal Distribution
Input Parameters
Results
Normal Distribution Visualization
About the Empirical Rule
Within 1σ
About 68% of values lie within one standard deviation of the mean
Within 2σ
About 95% of values lie within two standard deviations of the mean
Within 3σ
About 99.7% of values lie within three standard deviations of the mean
This free empirical rule calculator quickly determines the percentage of data within 1, 2, or 3 standard deviations of the mean in a normal distribution. Perfect for students, researchers, and analysts, it simplifies complex statistical calculations with step-by-step guidance. Enter your mean, standard deviation, and data range to explore probabilities and percentiles effortlessly.
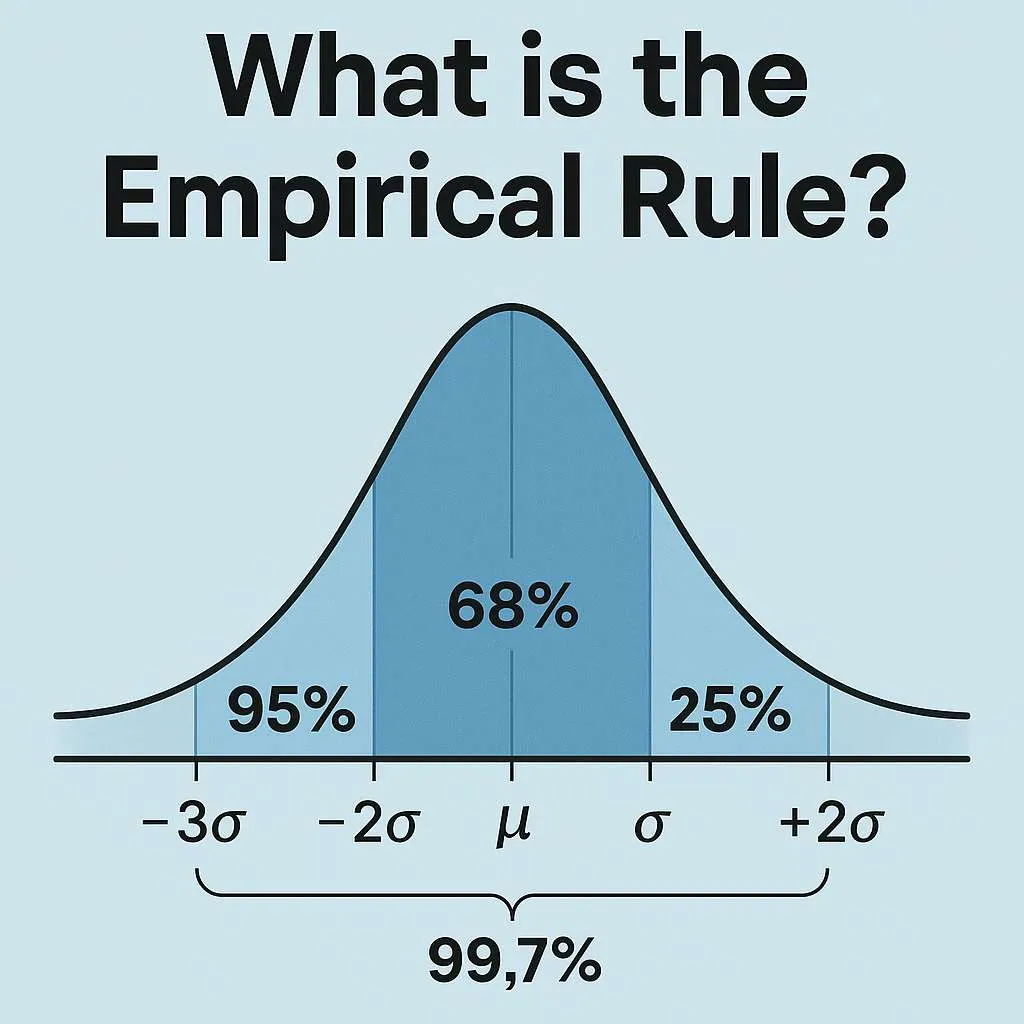
What is the Empirical Rule?
The empirical rule, also known as the 68-95-99.7 rule, is a statistical guideline that describes how data is distributed in a normal distribution, often visualized as a bell-shaped curve. It states that in a normally distributed dataset:
Approximately 68% of data falls within one standard deviation (σ) of the mean (μ).
About 95% of data lies within two standard deviations.
Roughly 99.7% of data is within three standard deviations.
This rule applies only to datasets that follow a normal distribution, where data clusters symmetrically around the mean. The empirical rule is widely used in statistics to estimate probabilities, percentiles, and data spread, making it invaluable for fields like education, finance, and quality control.
Empirical Rule Formula
The empirical rule provides a quick way to estimate the percentage of data within specific ranges of a normal distribution. The formula is expressed as:
μ ± 1σ: 68% of data lies within one standard deviation of the mean.
μ ± 2σ: 95% of data lies within two standard deviations.
μ ± 3σ: 99.7% of data lies within three standard deviations.
In mathematical terms, for a normal distribution with mean μ and standard deviation σ, the intervals are:
[ \begin{align*} \text{Within 1 SD: } & [\mu – \sigma, \mu + \sigma] \rightarrow 68% \ \text{Within 2 SD: } & [\mu – 2\sigma, \mu + 2\sigma] \rightarrow 95% \ \text{Within 3 SD: } & [\mu – 3\sigma, \mu + 3\sigma] \rightarrow 99.7% \end{align*} ]
This empirical rule percentage calculator simplifies these calculations by letting you input your dataset’s mean and standard deviation to find probabilities or percentiles.
How to Use the Empirical Rule (Step-by-Step)
Using an empirical rule calculator with steps is straightforward. Follow this example to understand how it works:
Example: Suppose the heights of adult males in a city have a mean (μ) of 70 inches and a standard deviation (σ) of 3 inches. You want to find the percentage of males with heights between 67 and 73 inches.
1.Identify the mean and standard deviation:
Mean (μ) = 70 inches, Standard Deviation (σ) = 3 inches.
2.Determine the range in terms of standard deviations:
Lower bound: 67 inches is 70 – 3 = μ – 1σ.
Upper bound: 73 inches is 70 + 3 = μ + 1σ.
This range (67 to 73 inches) lies within one standard deviation of the mean.
3.Apply the empirical rule:
According to the 68-95-99.7 rule, 68% of data falls within μ ± 1σ. Thus, approximately 68% of males have heights between 67 and 73 inches.
4.Use Z-scores for precision (optional):
To confirm, calculate the Z-score for a specific value, say 71 inches:
[ Z = \frac{x – \mu}{\sigma} = \frac{71 – 70}{3} = 0.33 ] Using a Z-table, a Z-score of 0.33 corresponds to roughly 62.93% of data below 71 inches. For a range between two numbers, subtract Z-score probabilities.
Our empirical rule calculator with mean and standard deviation automates these steps, providing instant results for any dataset. Simply input your values to find percentages or probabilities.
Real-World Examples
The empirical rule is a powerful tool for interpreting data in various fields. Here are two practical scenarios:
1.IQ Scores:
IQ scores are normally distributed with a mean of 100 and a standard deviation of 15. Using an empirical rule calculator with range:
• 68% of people have IQs between 85 (100 – 15) and 115 (100 + 15).
• 95% have IQs between 70 and 130.
•99.7% fall between 55 and 145.
This helps educators identify typical and outlier scores. For example, to determine the percentile using the empirical rule
calculator, input a score like 115 to find it’s in the top 16% (since 68% are within ±1σ, half of the remaining 32% are above 115).
2.Exam Scores:
Suppose a class’s exam scores have a mean of 75 and a standard deviation of 10. Using an empirical rule calculator for probability:
• 68% of students score between 65 and 85.
• To find the percentage of students scoring between 70 and 80 (using an empirical rule calculator between two numbers), calculate Z-scores and use the tool for precise probabilities. This helps instructors understand performance distributions.
These examples show how an empirical rule probability calculator aids in quick, real-world data analysis.
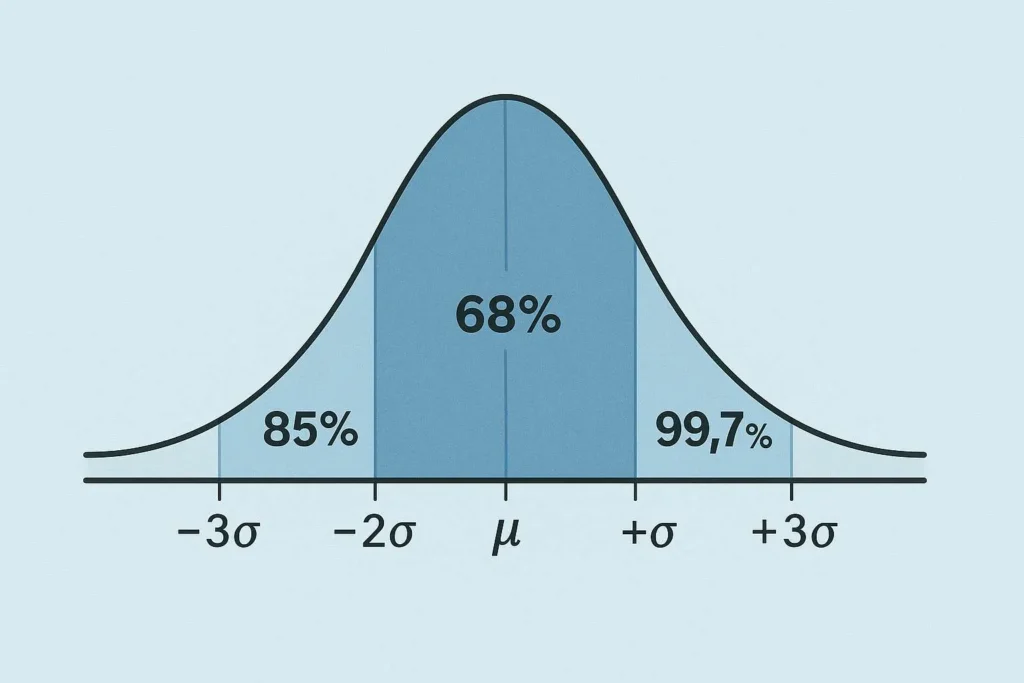
Visual Explanation
The empirical rule is best understood through the bell-shaped curve of a normal distribution. The curve is symmetric, with the mean at the center. Shaded areas represent the percentage of data within each standard deviation:
±1σ: The area between μ – σ and μ + σ covers 68% of the data.
±2σ: The area between μ – 2σ and μ + 2σ includes 95% of the data.
±3σ: The area between μ – 3σ and μ + 3σ encompasses 99.7% of the data.
When you use our empirical rule calculator with graph, a visual representation appears alongside the tool, showing these shaded regions for clarity. This helps users, especially students, grasp how data spreads in a bell-shaped distribution empirical rule calculator.
FAQs
The empirical rule, or 68-95-99.7 rule, describes the percentage of data within one, two, and three standard deviations of the mean in a normal distribution. It’s a quick way to estimate probabilities and percentiles.
You can use the empirical rule for normally distributed data, such as heights, IQ scores, or test results. It’s ideal for datasets that form a bell-shaped curve, as confirmed by our empirical rule calculator statistics.
The empirical rule applies only to normal distributions, providing specific percentages (68%, 95%, 99.7%). Chebyshev’s theorem applies to any distribution, offering minimum percentages but less precision. Learn more in our guide on Empirical Rule vs. Chebyshev’s Theorem.
The empirical rule is an approximation, accurate for perfectly normal distributions. Real-world data may deviate slightly, but our empirical rule approximate percentage calculator provides reliable estimates.
A Z-score measures how many standard deviations a data point is from the mean, calculated as ( Z = \frac{x – \mu}{\sigma} ). Our empirical rule z score calculator uses Z-scores to find precise probabilities or percentiles.
Use our empirical rule calculator between two numbers to input your range, mean, and standard deviation. It calculates the percentage of data within that interval, often using Z-scores for accuracy.
Related Resources
- What Is the Empirical Rule: A detailed explanation of the 68-95-99.7 rule.
- How to Use the Empirical Rule on a Calculator: Step-by-step guide to mastering this tool.
- Empirical Rule vs. Chebyshev’s Theorem: Compare these statistical tools for better analysis.
- Applications of the Empirical Rule in Statistics and Probability: Discover real-world uses.
- Normal Distribution and the Empirical Rule: Comprehensive insights into normal distributions.
- All Tools: Browse our full collection of statistical calculators.
Check Our Other Tools:
Empirical Rule Graph Generator
Visualize the 68-95-99.7 Rule with a bell curve showing standard deviation intervals. Great for quick insights and presentations.
Try CalculatorBell Curve Generator
Create customizable bell curve plots for any normal distribution. Perfect for data analysis and visual reports.
Standard Deviation Shading Calculator
Shade areas under the curve based on standard deviation. Instantly see data coverage between values.
Try CalculatorZ-Score to Graph Plotter
Plot Z-scores on a bell curve and see where your value lies. Understand percentiles and probabilities at a glance.
Try CalculatorEmpirical Rule Percentile Calculator
Quickly estimate percentiles in a normal distribution using the 68-95-99.7 rule. Input mean, standard deviation, and a score to find its percentile rank.
Try CalculatorZ-Score to Percentile Converter
Convert a z-score to a percentile in a normal distribution. Enter your z-score to see the percentage of data below it, ideal for test scores or analytics.
Try CalculatorPercentile Rank Calculator
Find your score’s percentile rank without needing mean or standard deviation. Input your score and rank to see where you stand in any dataset.
Try CalculatorNormal Distribution to Percentile Visualizer
Visualize your score on a bell curve with shaded percentile areas. Enter mean, standard deviation, and a score to see its rank in a normal distribution.
Try CalculatorEmpirical Rule Probability Finder
Calculate probabilities under a normal distribution using the 68-95-99.7 rule with easy inputs and visual bell curve outputs.
Try CalculatorLeft/Right Tail Probability Calculator
Find left or right tail probabilities in a normal distribution using z-scores, perfect for hypothesis testing and p-values.
Try CalculatorProbability to Z-Score Approximation Tool
Convert cumulative probabilities to z-scores in a normal distribution, ideal for test scores and data analysis.
Try CalculatorEmpirical Rule Zones Probability Tool
Estimate probabilities within 1, 2, or 3 standard deviations using the 68-95-99.7 rule, with shaded bell curve visuals.
Try Calculator