What is the Empirical Rule?
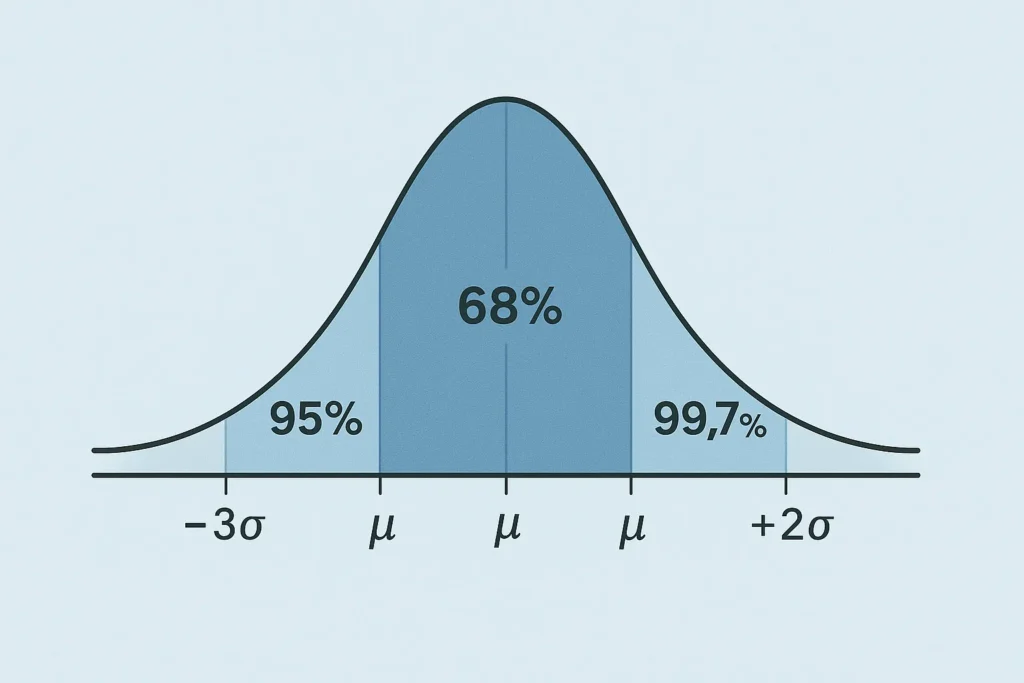
The empirical rule, also known as the 68-95-99.7 rule, is a simple way to understand how data spreads in a normal distribution. It shows how much of your data falls near the average, or mean, in a bell-shaped dataset. Specifically, it tells us:
- About 68% of data is within one standard deviation of the mean.
- Around 95% of data lies within two standard deviations.
- Roughly 99.7% of data falls within three standard deviations.
This rule is perfect for students, teachers, or anyone curious about statistics, as it simplifies analyzing data like test scores or heights. If you want to explore this rule with your own numbers, a statistical tool can make it quick and easy.
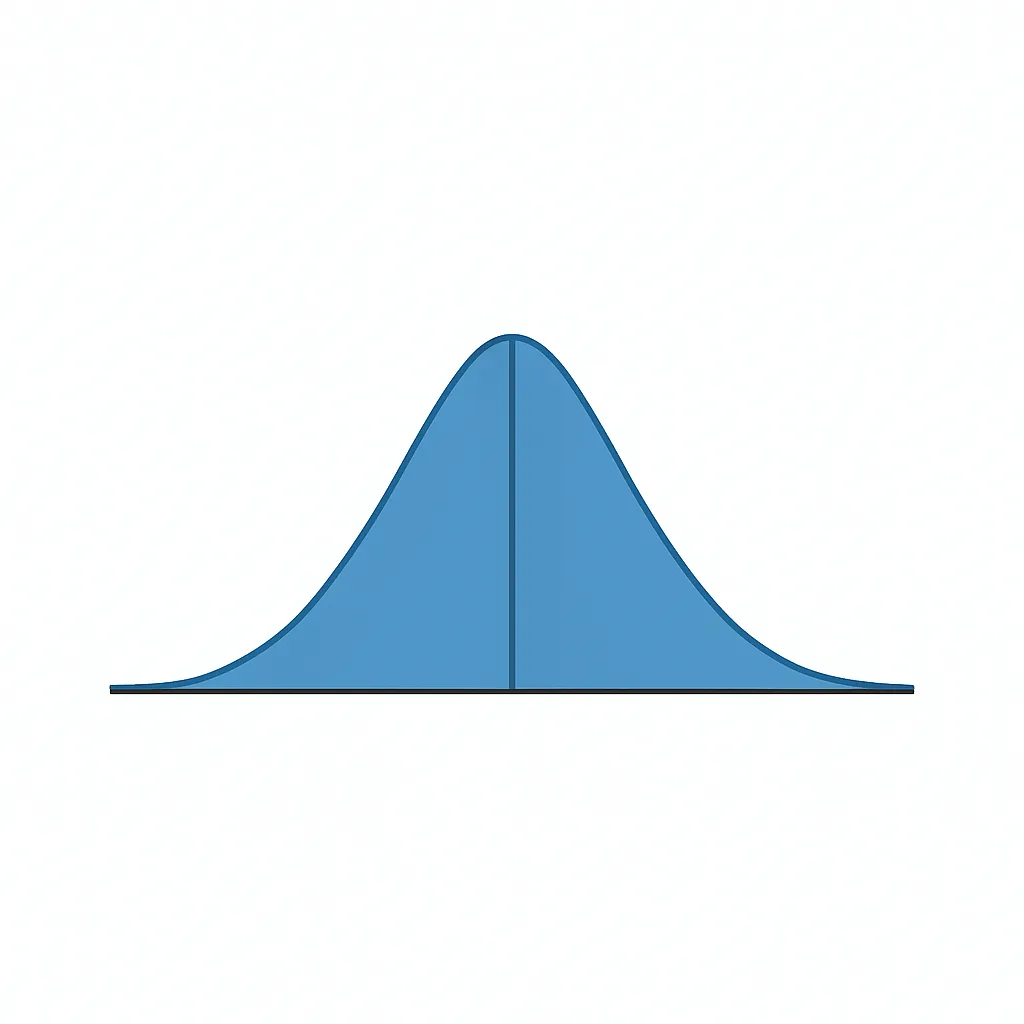
Understanding the Bell Curve
A normal distribution forms a bell curve, a symmetric shape where most data clusters around the mean, with fewer values at the extremes. The mean is the center of the curve, and the standard deviation measures how spread out the data is. This bell-shaped pattern is common in real-world data, like IQ scores or weights, making the empirical rule a go-to for quick insights.
The Empirical Rule Formula
The empirical rule formula shows the percentage of data within specific ranges in a normal distribution:
- Mean ± 1 standard deviation → 68% of data.
- Mean ± 2 standard deviations → 95% of data.
- Mean ± 3 standard deviations → 99.7% of data.
Here, the mean (denoted as μ, or mu) is the average of your data, and the standard deviation (σ, or sigma) measures how much the data varies from the mean.
| Range | Percentage | Example (Mean = 50, SD = 5) |
|---|---|---|
| Mean ± 1 SD | 68% | 45 to 55 |
| Mean ± 2 SD | 95% | 40 to 60 |
| Mean ± 3 SD | 99.7% | 35 to 65 |
This table clarifies how the rule applies to any normal dataset. To learn more about normal distributions, you can dive deeper into related statistical concepts.
Real-Life Examples of the Empirical Rule
Let’s see the empirical rule in action with practical examples that bring the concept to life.
1.Heights of Adult Men
Suppose the heights of adult men in a town have a mean of 70 inches and a standard deviation of 3 inches. Using the empirical rule:
- 68% of men are between 67 inches (70 – 3) and 73 inches (70 + 3).
- 95% are between 64 inches and 76 inches.
- 99.7% are between 61 inches and 79 inches.
If you’re curious about the percentage of men shorter than 73 inches, the rule suggests about 84% (50% below the mean plus half of the 68% within one standard deviation).
2.SAT Scores
SAT scores often follow a normal distribution with a mean of 1000 and a standard deviation of 200. The empirical rule tells us:
- 68% of students score between 800 and 1200.
- 95% score between 600 and 1400.
- 99.7% score between 400 and 1600.
This helps schools understand score distributions and identify outliers.
3.Delivery Times
A courier service has delivery times with a mean of 40 minutes and a standard deviation of 6 minutes. The empirical rule shows:
- 68% of deliveries take 34 to 46 minutes.
- 95% take 28 to 52 minutes.
- 99.7% take 22 to 58 minutes.
This helps the company set realistic delivery expectations.
Did You Know? The empirical rule is great for estimates, but for precise calculations, you might need tools like a Z-score calculator.
When Can You Use the Empirical Rule?
The empirical rule works best for data that follows an approximately normal distribution, meaning it forms a bell-shaped curve. You’ll see this in datasets like heights, exam grades, or certain measurements in nature. It’s ideal when you have a large enough sample (usually 30 or more observations) and want quick estimates of data spread.
How does it compare to other methods? The empirical rule is specific to normal distributions, giving exact percentages (68%, 95%, 99.7%). In contrast, Chebyshev’s Theorem applies to any dataset but offers less precise estimates, like at least 75% of data within two standard deviations versus 95% for the empirical rule.
Limitations of the Empirical Rule
The empirical rule isn’t perfect and has some constraints:
- Normal Distribution Required: It only applies to bell-shaped, symmetric data. Skewed data, like income or time-to-failure, won’t work.
- Sample Size: Small datasets (fewer than 30) may not follow a normal distribution, making the rule unreliable.
- Approximation: The 68-95-99.7 percentages are estimates, not exact, especially for slightly non-normal data.
- Outliers: Extreme values can skew the mean or standard deviation, affecting results.
Before applying the rule, use a histogram or normality test to confirm your data is bell-shaped.
FAQs
It’s the empirical rule, stating that in a normal distribution, 68% of data is within one standard deviation of the mean, 95% within two, and 99.7% within three.
Find your data’s mean and standard deviation, then use the rule to estimate the percentage of data within one, two, or three standard deviations.
It simplifies understanding data spread in normal distributions, making it useful for students, analysts, and researchers.
It’s an approximation, reliable only for data that closely follows a normal distribution.
Don’t use it for skewed, non-normal, or small datasets, as the percentages won’t be accurate.
No, it’s only valid for datasets that are approximately normal and form a bell-shaped curve.
Other Resources:
- How to Use the Empirical Rule on a Calculator: Step-by-step guide to mastering this tool.
- Empirical Rule vs. Chebyshev’s Theorem: Compare these statistical tools for better analysis.
- Applications of the Empirical Rule in Statistics and Probability: Discover real-world uses.
- Normal Distribution and the Empirical Rule: Comprehensive insights into normal distributions.
- All Tools: Browse our full collection of statistical calculators.