Percentile Rank Calculator
You can also use spaces or line breaks as separators
How to Use
- Enter your dataset in the textarea (comma-separated)
- Enter the target value you want to find the percentile rank for
- Click "Calculate Percentile Rank" to see the result
Sample Data
Try this example:
10, 20, 30, 40, 50, 60, 70, 80, 90, 100
Target Value: 75
Results
Percentile Rank
Data Distribution
Interpretation
What does this mean?
Formula Used
Percentile Rank = ((Number of values below target + 0.5 × Number of values equal to target) / Total number of values) × 100
Key Points
- Percentile rank shows what percentage of values are below your target value
- A percentile rank of 50% means the value is at the median (middle) of the dataset
- Higher percentile ranks indicate the value is relatively high in the dataset
- Lower percentile ranks indicate the value is relatively low in the dataset
The percentile rank calculator is a simple tool that shows where your score stands compared to others in a group, expressed as a percentage. If you’re a student checking exam results, a test-taker analyzing SAT scores, a teacher ranking a class, or an HR professional evaluating candidates, this tool helps you quickly find percentile rank without needing to know complex statistics like mean or standard deviation. Just input your score and its position relative to others, and the calculator does the rest. This guide explains how the score percentile calculator works, its applications, and why it’s so useful. Ready to try it? Explore our main statistics tool for easy calculations.
What Is Percentile Rank?
Percentile rank tells you the percentage of scores in a group that are below yours. For example, if your test score is in the 80th percentile, you scored better than 80% of the group. It’s a straightforward way to understand your performance relative to others.
Real-Life Examples:
SAT Scores: If your SAT score is in the 90th percentile, you outperformed 90% of test-takers.
Class Exams: A score in the 75th percentile means you did better than three-quarters of your classmates.
Employee Rankings: An HR manager might use percentile ranks to compare sales performance across a team.
Percentile Rank vs. Percentile Value:
Percentile Rank: A percentage showing your score’s position (e.g., 80th percentile = 80% of scores are below yours).
Percentile Value: The actual score at a given percentile (e.g., the score at the 80th percentile might be 85 points).
This distinction is key for interpreting rankings. To dive deeper into percentiles, check out percentile concepts .
How to Use the Percentile Rank Calculator
The percentile rank calculator is easy to use and requires minimal inputs:
Enter Your Score: Input your raw score (e.g., 85 on a test).
Input Total Number of Scores: Provide the total number of scores in the group (e.g., 100 students).
Enter Number of Scores Below Yours: Specify how many scores are lower than yours (e.g., 70 students scored below 85). Alternatively, some calculators accept your rank (e.g., 30th out of 100).
Calculate: The tool computes the percentile rank using the formula:
[ \text{Percentile Rank} = \left( \frac{\text{Number of Scores Below}}{\text{Total Number of Scores}} \right) \times 100 ]View Output: The result is your percentile rank as a percentage (e.g., 70%).
Example:
You scored 85 on a test.
Total students: 100.
70 students scored below 85.
Percentile Rank: ( \frac{70}{100} \times 100 = 70% ).
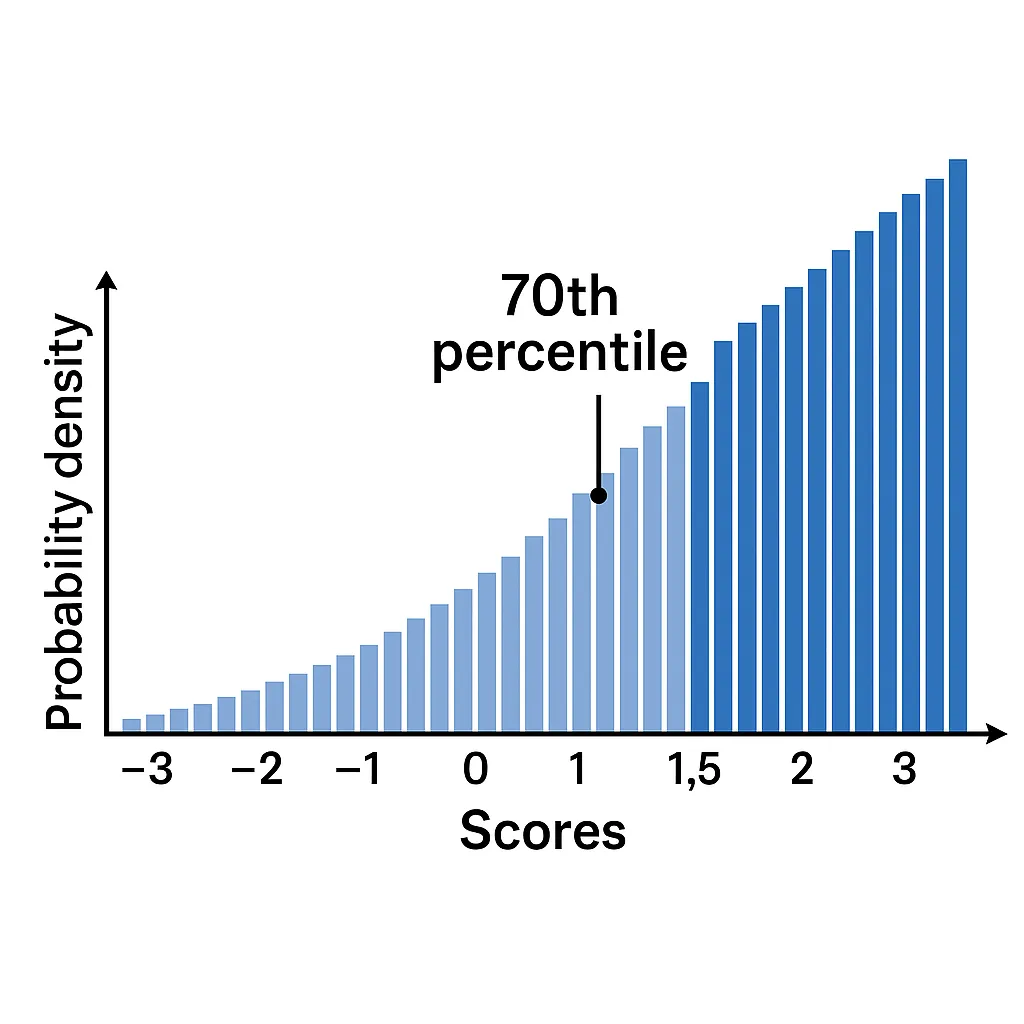
Your score is in the 70th percentile, meaning you outperformed 70% of the group. For normal distribution-based percentiles, try our normal distribution tool.

Why Use This Tool?
The percentile ranking tool is versatile and practical for:
Standardized Tests: Interpret SAT, GRE, or ACT results to see how you compare to others (test score percentile).
School Rankings: Teachers can rank students based on exam performance without needing statistical assumptions.
Employee Evaluations: HR professionals can compare employee performance, like sales or productivity, across a team.
General Rankings: Use it for any dataset where relative position matters, like sports or market rankings.
Unlike tools requiring a normal distribution, this calculator works for any dataset, making it ideal for percentile calculator no standard deviation scenarios. For visual insights, explore our percentile visualizer .
Percentile Rank vs. Z-Score: What’s the Difference?
Percentile Rank: Shows the percentage of scores below yours, applicable to any dataset. It’s about your relative position.
Z-Score: Measures how far a score is from the mean in standard deviations, assuming a normal distribution.
Example:
Test Score Scenario: A score of 90 in a class of 100, with 80 scores below it, gives a percentile rank of 80%. If the data is normal with a mean of 85 and standard deviation of 5, the z-score is (90 – 85) / 5 = 1, roughly the 84th percentile.
Non-Normal Data: Percentile rank works for skewed data (e.g., income rankings), while z-scores require a bell-shaped curve.
| Feature | Percentile Rank | Z-Score |
|---|---|---|
| Measures | % of scores below | Distance from mean |
| Data Type | Any dataset | Normal distribution |
| Example | 80th percentile = 80% below | Z = 1 ≈ 84th percentile |
Real-Life Examples of Percentile Ranks
Standardized Tests: A GRE score in the 85th percentile means you scored better than 85% of test-takers, helping graduate schools assess your performance.
School Grades: If 40 out of 50 students scored below your 92, your percentile rank is 80%, showing you’re in the top 20% of the class.
Fitness Tests: In a company fitness challenge, a 5K run time in the 90th percentile indicates you’re faster than 90% of participants.
Market Rankings: A product ranked 10th out of 200 has a percentile rank of 95%, meaning it’s among the top 5% in sales.
To explore more applications, check out real-world percentile uses .
FAQs
A “good” percentile rank depends on context. For tests, above the 50th percentile is above average; the 90th percentile or higher is exceptional.
No, percentile rank ranges from 0 to 100, as it represents the percentage of scores below yours.
A percentile ranks your score relative to others (e.g., 80th percentile = better than 80%). A percentage is a raw score out of 100 (e.g., 80% on a test).
Yes, but small datasets (e.g., fewer than 10 scores) may have less precise rankings due to limited data points.
The percentile rank calculator works for any dataset, while normal distribution percentiles (like the 68-95-99.7 rule) assume a bell-shaped curve.
Conclusion
The z-score to percentile converter simplifies the process of finding percentile from z-score in a normal distribution, making it easy to rank data points like test scores or measurements. By transforming z-scores into percentiles, this tool helps students, analysts, and researchers understand data positioning without complex math. Whether you’re evaluating academic performance or analyzing data trends, this converter offers clear insights. Try our main statistics calculator to explore more, or use related tools like the percentile tool , rank calculator , distribution visualizer , and learn about percentile concepts or real-world percentile uses for a complete statistical toolkit.
Empirical Rule Graph Generator
Visualize the 68-95-99.7 Rule with a bell curve showing standard deviation intervals. Great for quick insights and presentations.
Try CalculatorBell Curve Generator
Create customizable bell curve plots for any normal distribution. Perfect for data analysis and visual reports.
Standard Deviation Shading Calculator
Shade areas under the curve based on standard deviation. Instantly see data coverage between values.
Try CalculatorZ-Score to Graph Plotter
Plot Z-scores on a bell curve and see where your value lies. Understand percentiles and probabilities at a glance.
Try Calculator
